Projects
A curated selection of projects I worked in the past years. Each entry includes a short overview, key contributions, and the tech used.
ManaWorks
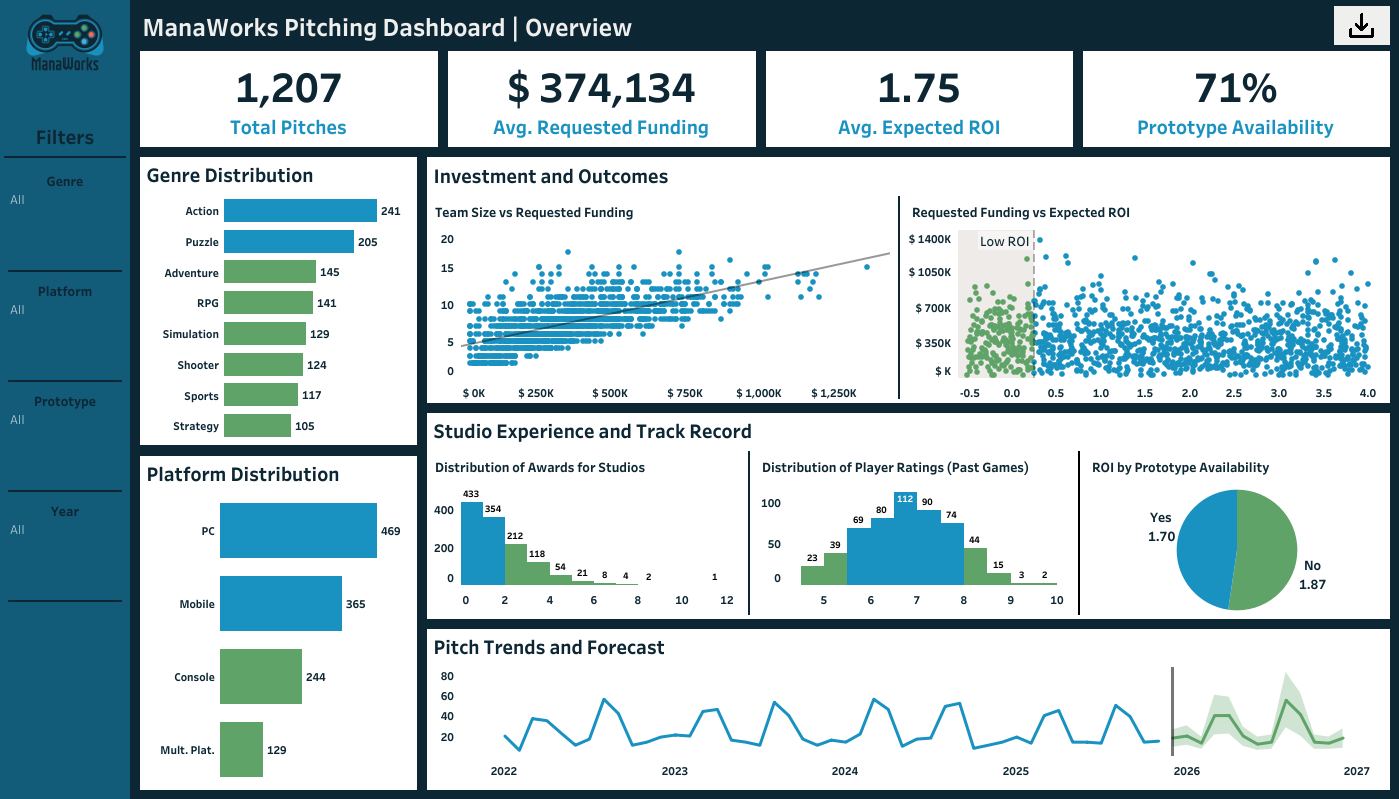
Game Publisher Pitching Dashboard to understand patterns of project pitches.
- Created a Tableau dashboard for pitching overview for a game publisher.
- Analyzed project data such as requested revenue, expected ROI and more.
Tech: Tableau and Python
GameVerse
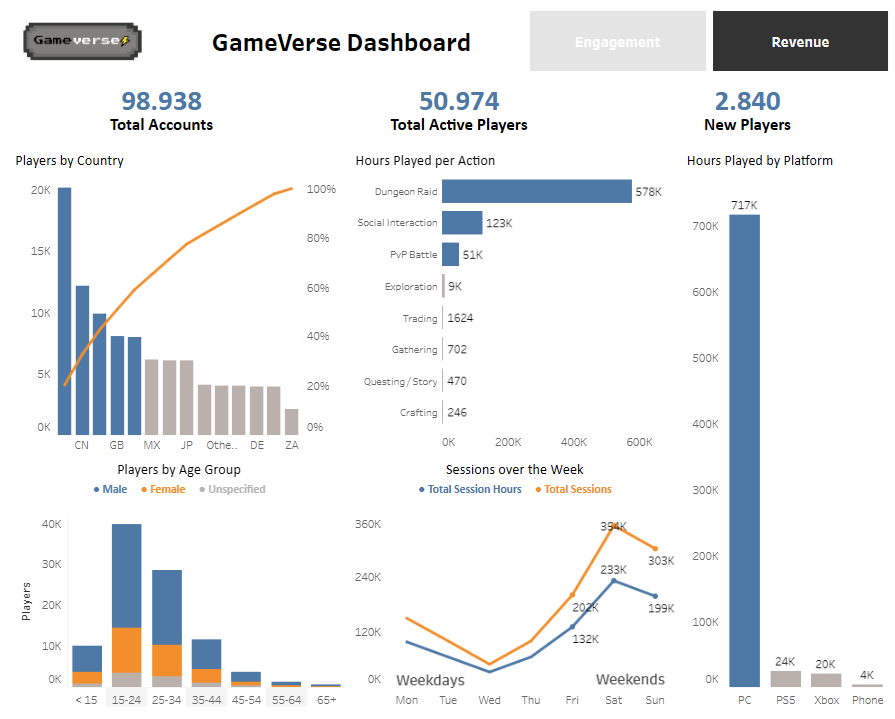
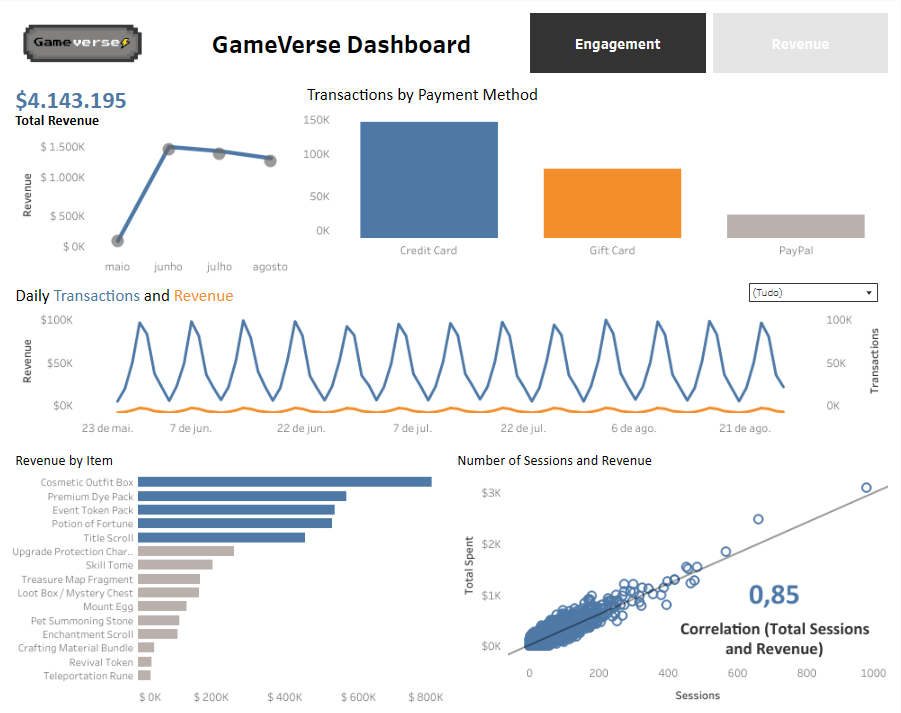
Game Studio Analysis Case Study to understand playerbase engagement and game revenue.
- Created databricks ETL pipeline with Spark using the medallion architecture.
- Created EDA visualization with Excel and then a dashboard with Tableau.
Tech: Databricks, Spark, SQL, Excel, Tableau and Python
DATASUS Mortality Dashboard
Research prototype exploring Brazilian SUS mortality data with interactive visual narratives.
- Designed filters and views by cause, region, and time
- Engineered data cleaning to handle public dataset edge cases
Tech: R, Shiny, ggplot2
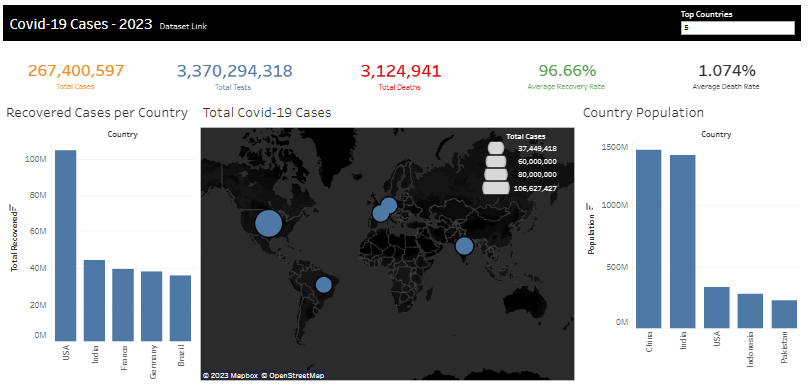
Tableau Data Visualizations
Tableau dashboards built from public datasets, focusing on clear KPIs and comprehension.
- Rapid EDA to identify the most relevant metrics
- Single-view dashboards to support cohesive storytelling
Tech: Tableau and Excel
Gesture Recognition with Leap and ML
Comparison of ML Algorithms to classify gestures with Leap Motion
- Created a dataset with hand gesture data from 4 people with C and Leap Motion.
- Used ML and compared performance results for gesture classification.
Tech: C, Python, scikit-learn and Leap Motion
HCI-Guided Dashboard Development
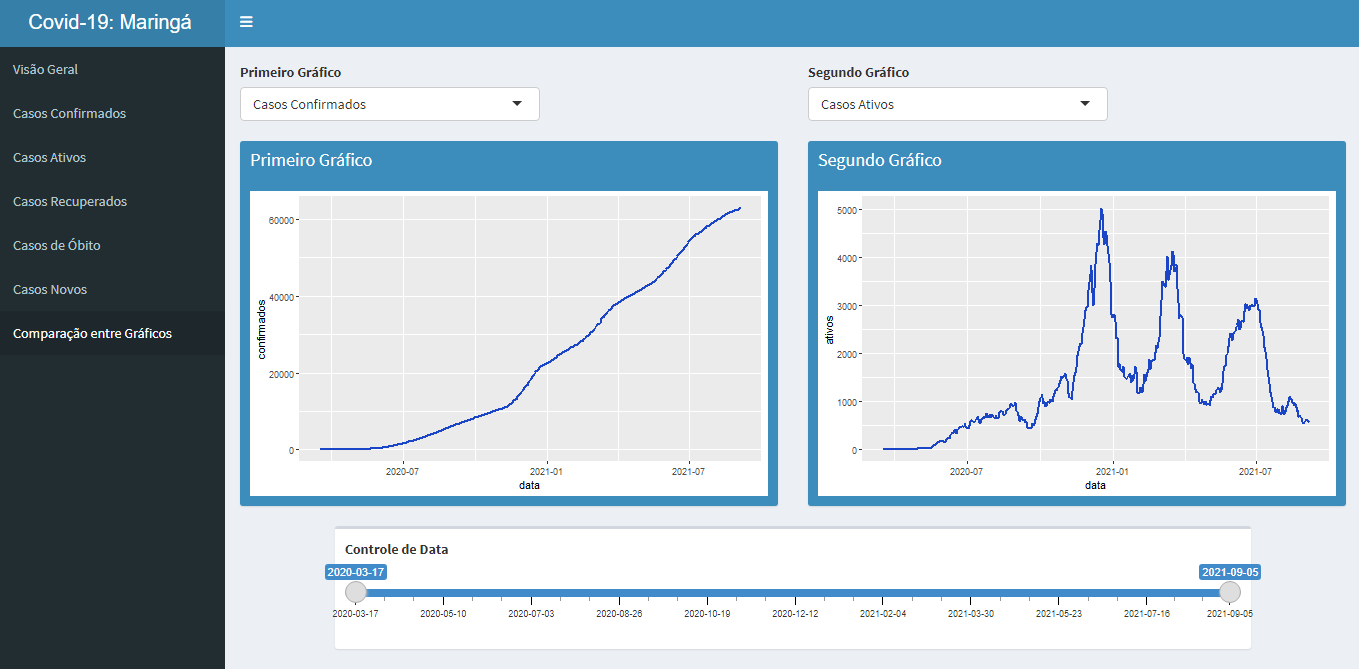
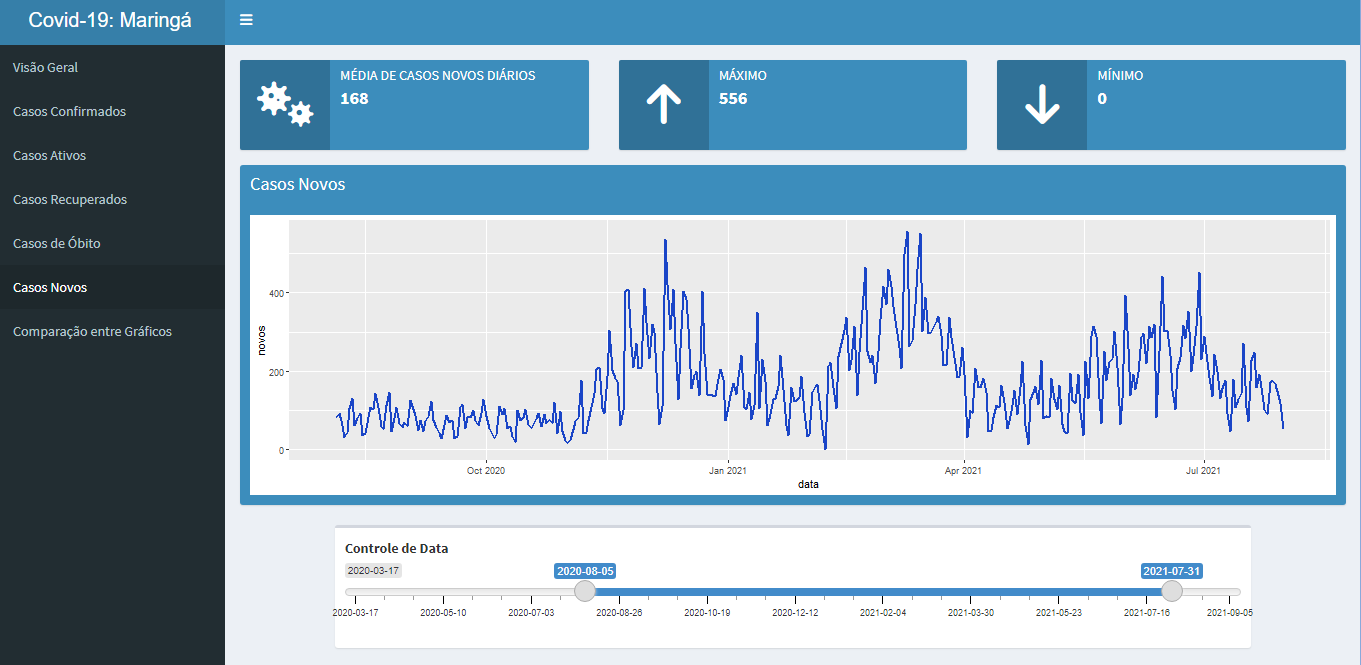
HCI techniques applied to a dashboard using open COVID-19 data for Maringá.
- Ran user research and translated findings into UI/UX requirements
- Built an interactive prototype aligned to HCI best practices
Tech: R, Shiny, ggplot2, HCI methods
Private Repo | More details
ManaWorks
This is a fictitious project (repo available here) where I took on the role of a Data Analyst, tasked with developing a Tableau dashboard for a game publisher called ManaWorks. The company regularly receives project pitches from various game studios seeking investment. To decide whether to invest, ManaWorks evaluates data such as Requested Funding, Prototype Availability, Game Genre, Target Platform, Expected ROI, and other key factors.
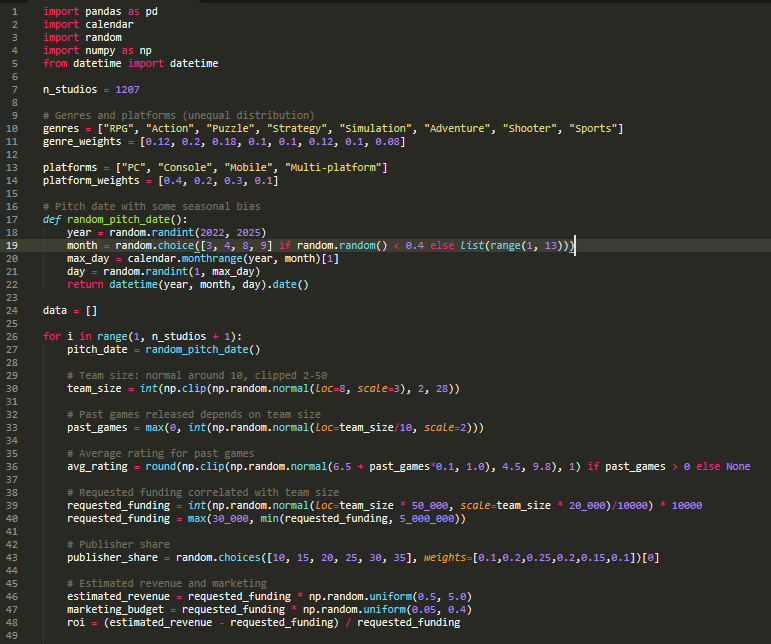
To simulate this scenario, I used Python to generate a synthetic dataset, which allowed me to perform exploratory data analysis and identify the most relevant information to highlight in the dashboard. I then used Tableau to import the data, build sheets, create calculated fields, apply filters, and design a fully stylized dashboard based on ManaWorks’ color palette.
GameVerse
For my GameVerse project (repo available here), I acted as a data engineer and analyst for a mid-sized game studio running an online multiplayer RPG. The objective was to understand player engagement and the impact of in-game purchases on revenue using data from the past three months. To achieve this, I simulated realistic game data—including player sessions, profiles, and purchase transactions—using a custom Python script, which generated multiple datasets that mimicked real-world database tables. This allowed me to work with a comprehensive, multi-source dataset while maintaining a realistic scenario for analysis.
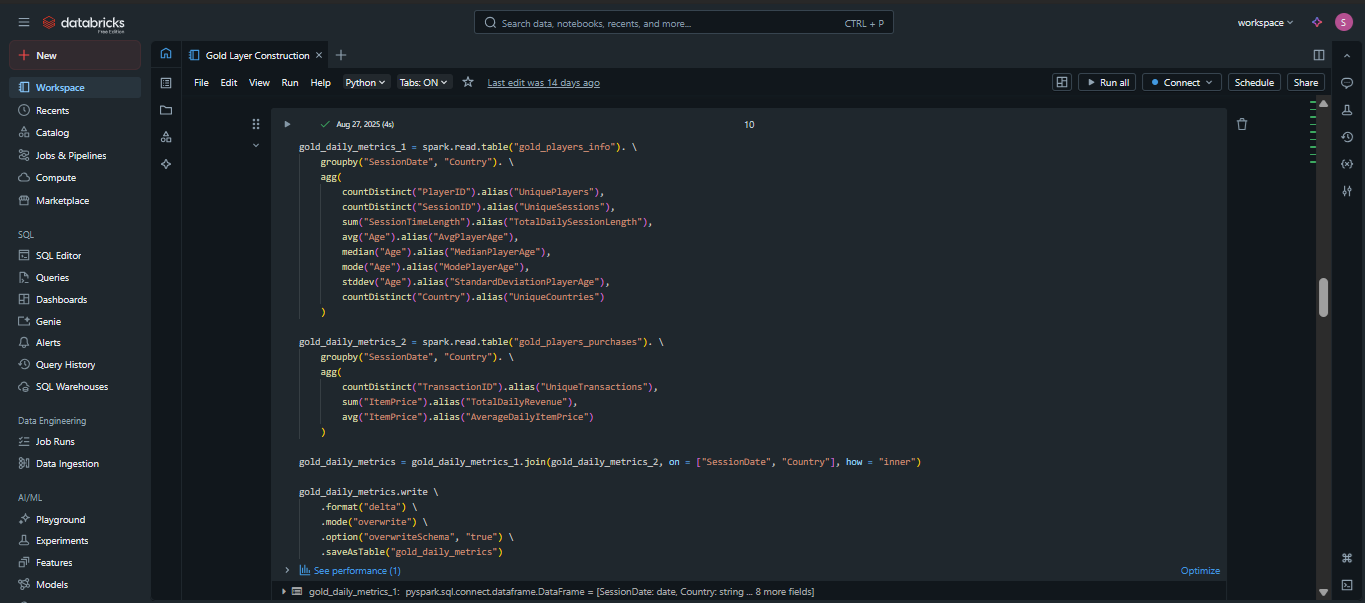
I built a robust ETL pipeline in Databricks to transform raw, heterogeneous data into clean, analysis-ready datasets. The pipeline follows a traditional bronze-silver-gold architecture: the bronze layer stores raw data mostly as strings, the silver layer ensures data quality through type conversions, consistent naming, and deduplication, and the gold layer denormalizes tables and aggregates key metrics to optimize performance for downstream analytics. This structured approach ensured that the Analytics team could easily use the processed data in Tableau dashboards and Excel workbooks for exploratory data analysis and storytelling.
The project showcases my ability to integrate multiple technologies—Databricks, Spark/PySpark, SQL, Python, Tableau, and Excel—to deliver actionable insights. The final deliverables include interactive Tableau dashboards and a comprehensive Excel workbook that highlight player behavior trends, revenue patterns, and other KPIs relevant to the business. Overall, this project demonstrates my skills in end-to-end data engineering, data cleaning, pipeline design, and translating complex datasets into clear, business-oriented analyses.
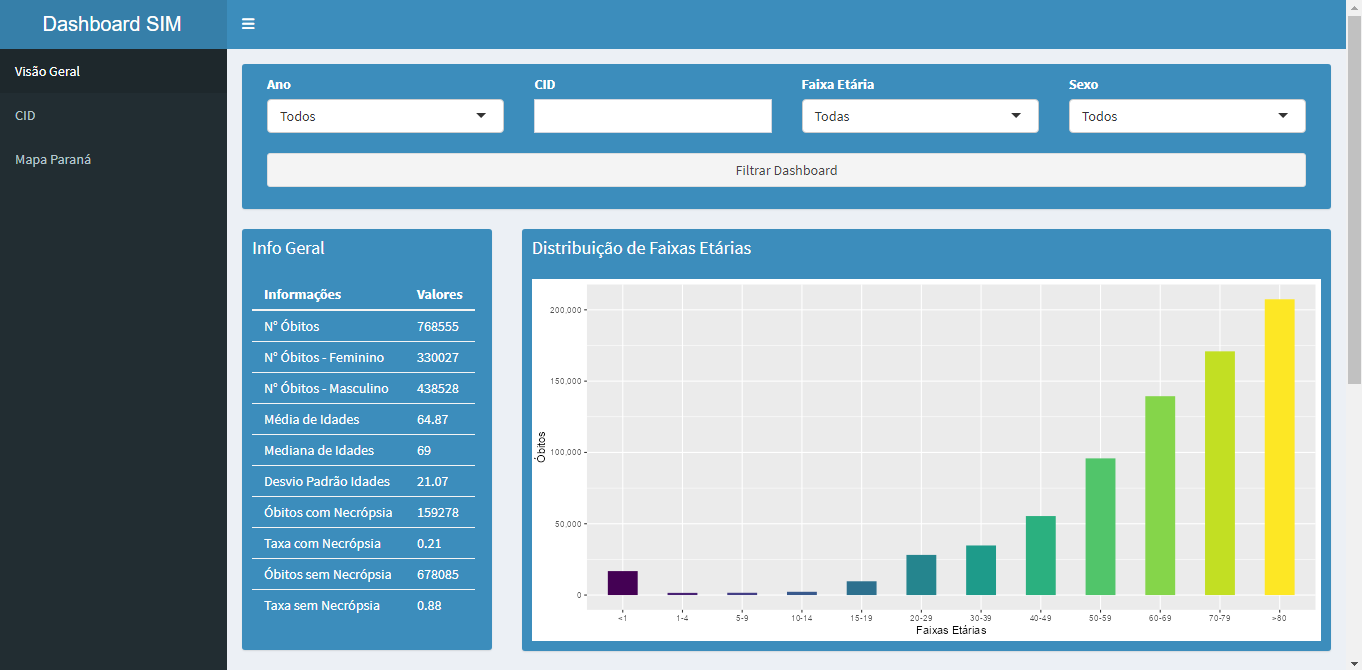
DATASUS Mortality Dashboard
I conducted a year-long undergraduate research project focused on developing an innovative solution for visualizing mortality data using publicly available datasets from Brazil’s Universal Health Care System (SUS).
The project leveraged R, Shiny, and ggplot2 to build a dashboard prototype. While data acquisition was straightforward thanks to open access, the main challenges lay in data cleaning and manipulation due to complex and case-specific inconsistencies.
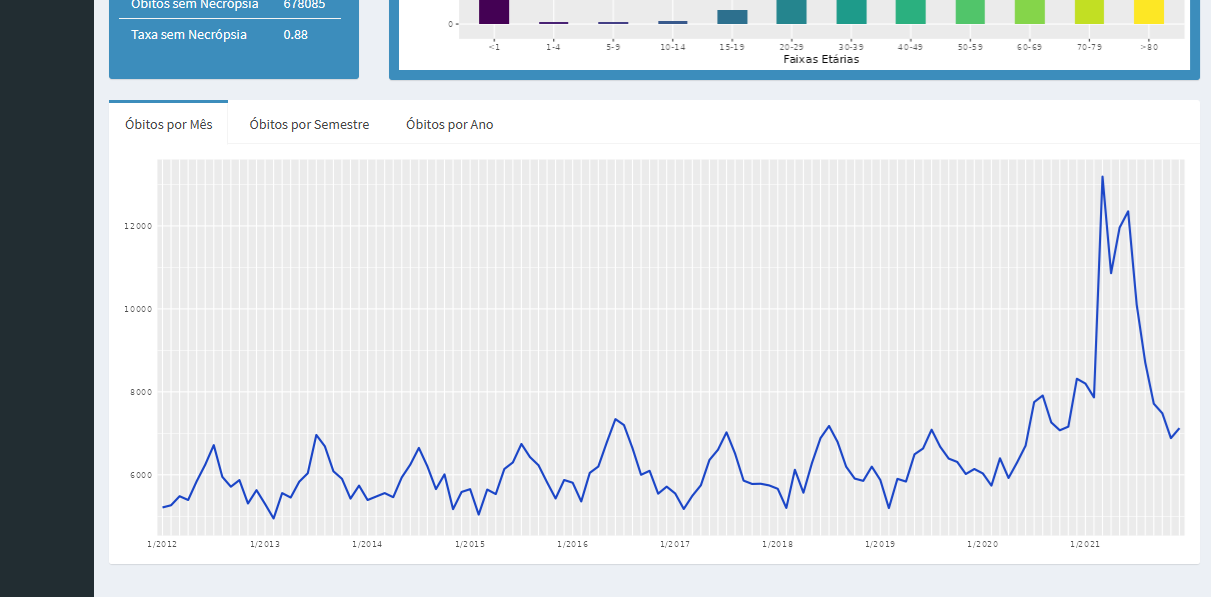
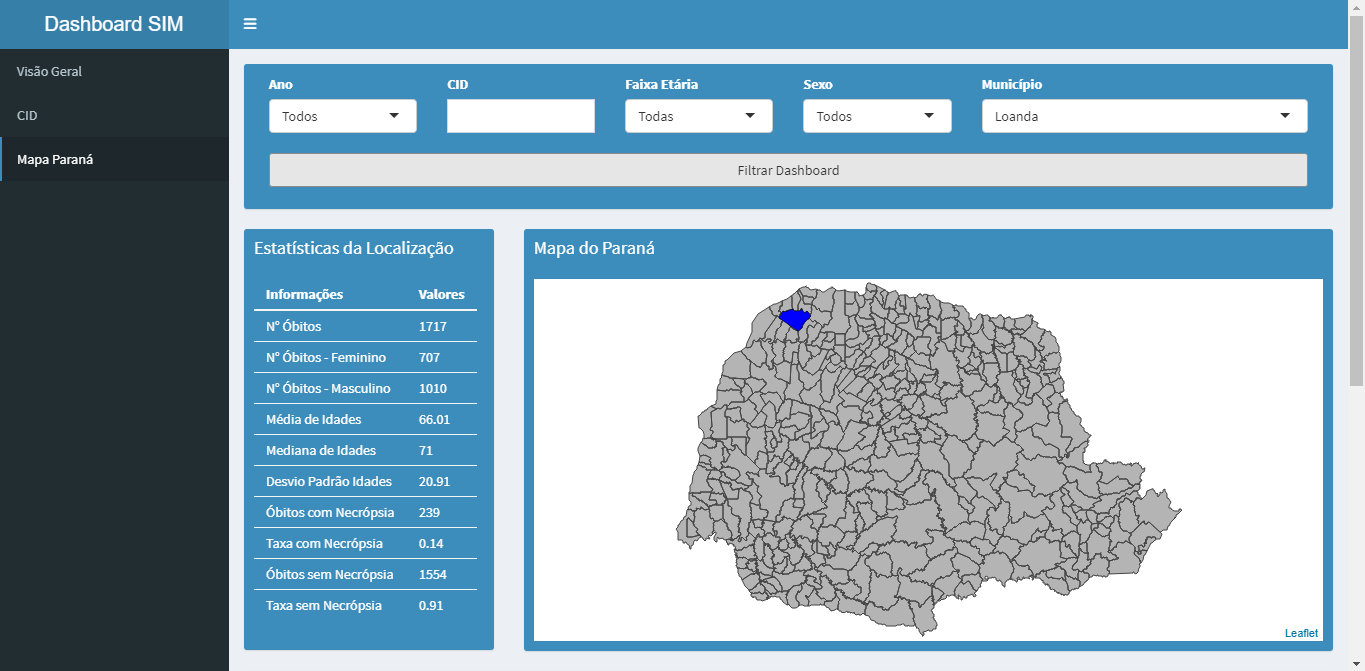
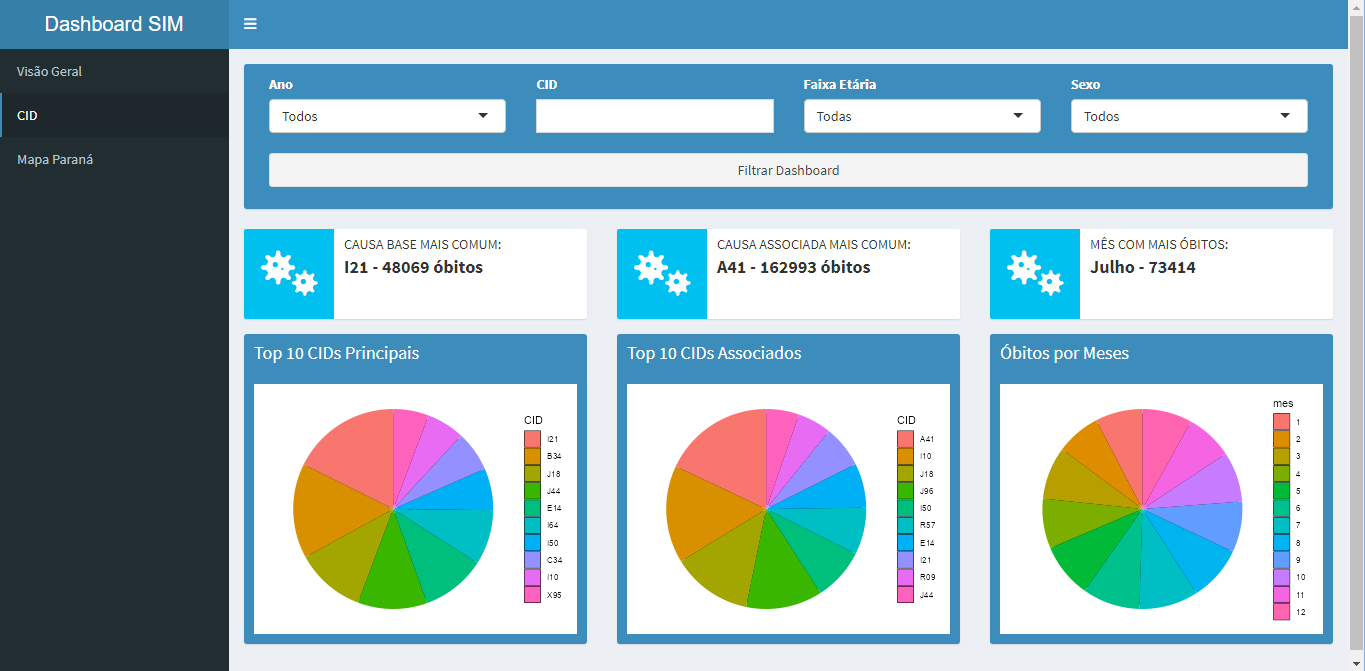
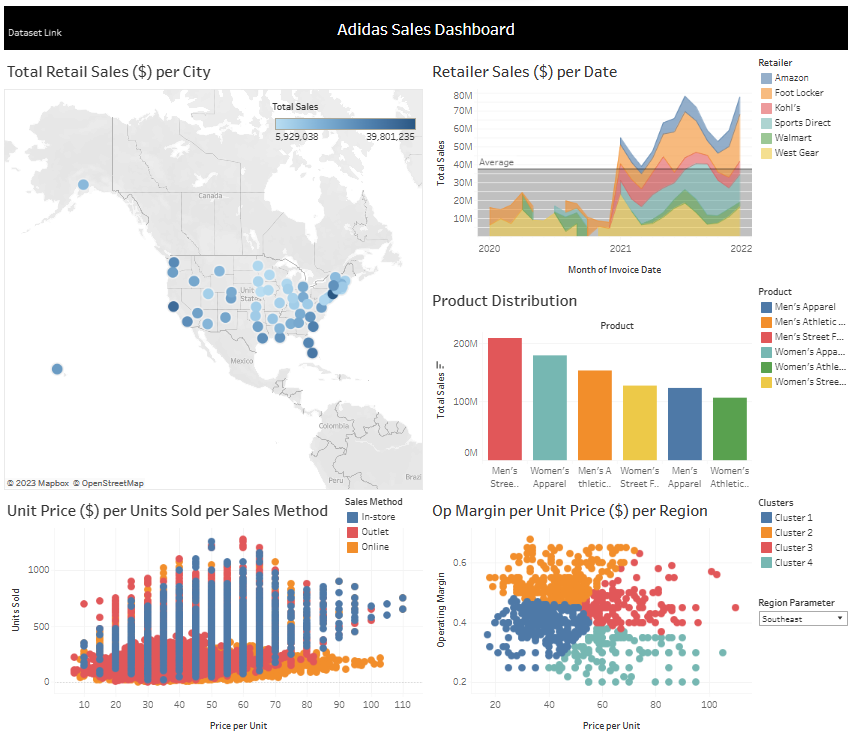
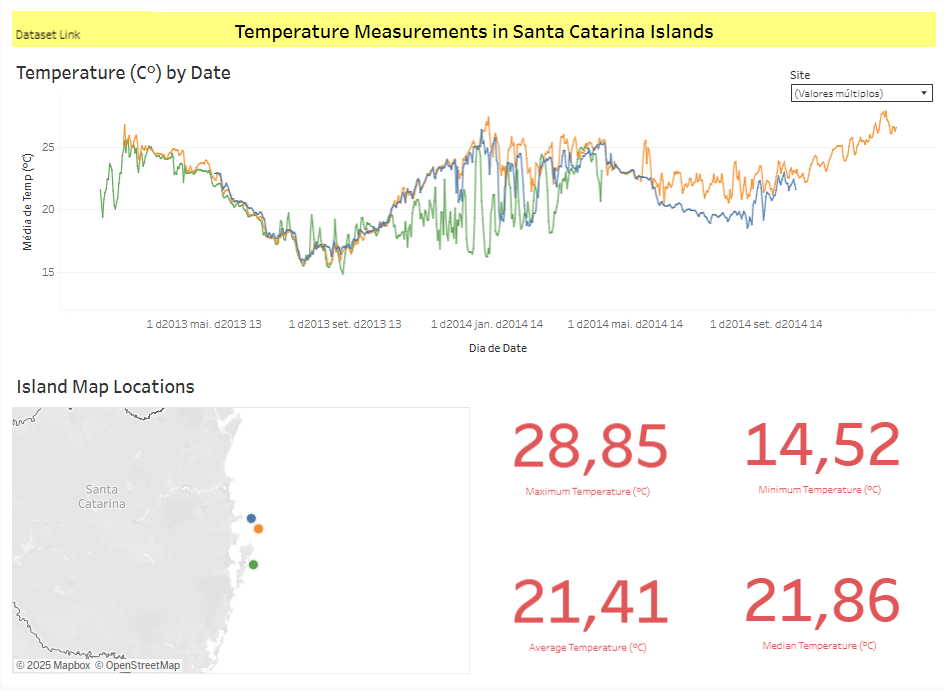
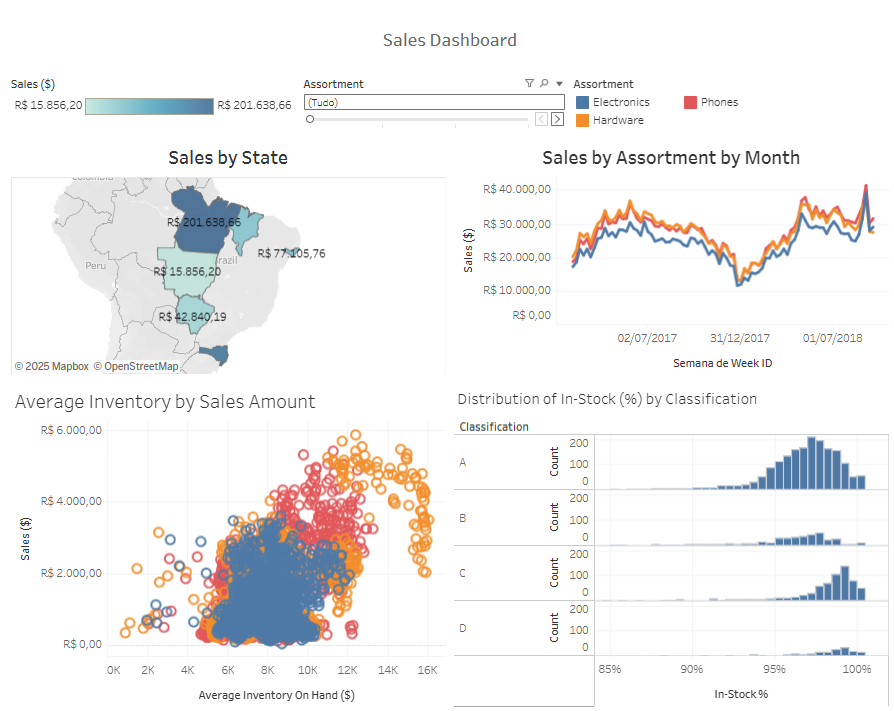
Tableau Data Visualizations
After completing a LinkedIn Learning course (see the Achievements tab), I started exploring public datasets from Kaggle and creating interactive dashboards using Tableau. Leveraging Tableau’s features—such as calculated fields, filters, parameters, and dynamic visualizations—I was able to transform raw data into compelling stories. While R and Shiny offer extensive customization, Tableau excels with its intuitive drag-and-drop interface, rapid dashboard development, and built-in visualization types like heat maps, treemaps, and trend lines that make insights more accessible and engaging.
Through this hands-on experience, I gained practical knowledge in dashboard design, including prioritizing the most relevant metrics, defining key performance indicators (KPIs), and optimizing visual layouts for clarity and impact.
Gesture Recognition with Leap Motion and ML
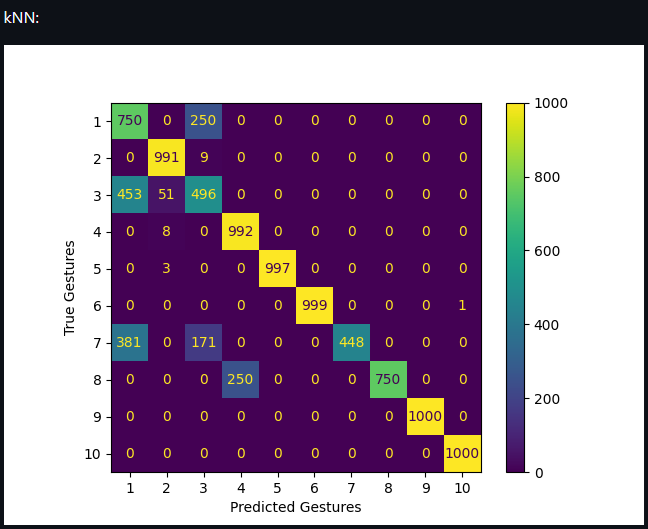
This project used the Leap Motion sensor by Ultraleap to collect hand-tracking data from four participants with different hand sizes. Each participant was asked to perform a set of predefined gestures taken from a gesture vocabulary proposed in a previous study. The data collection was carried out using the C programming language and the LeapC SDK. Afterward, the dataset was processed and cleaned to serve as input for machine learning classifiers.
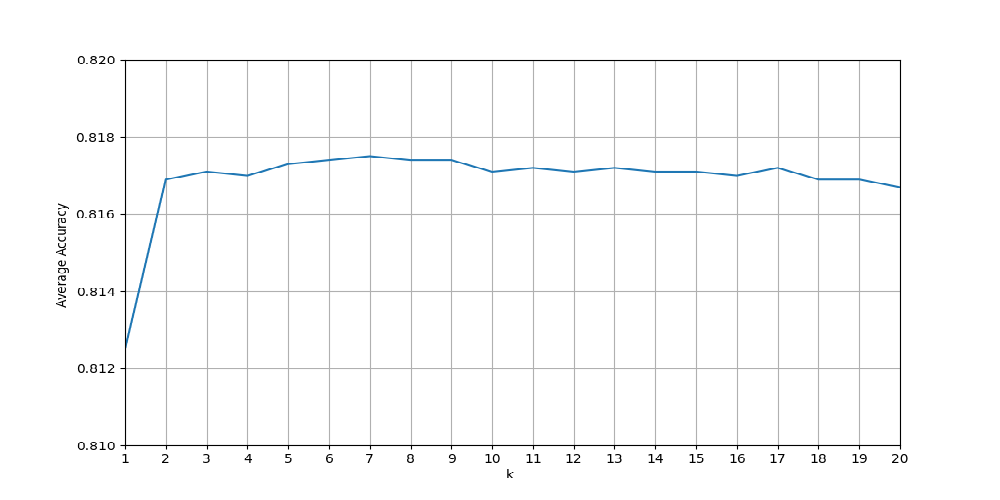
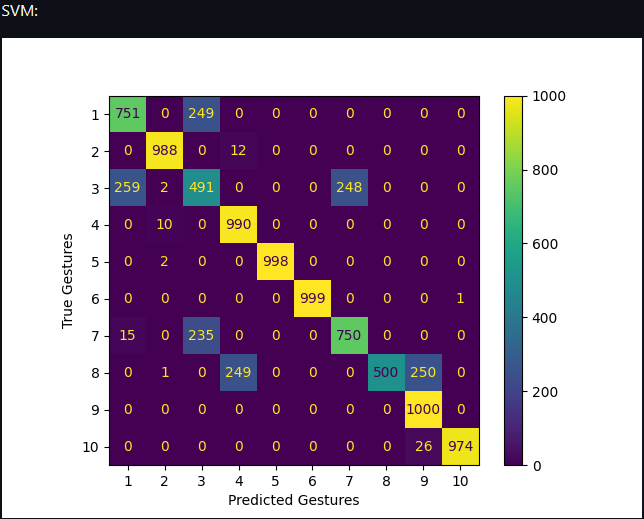
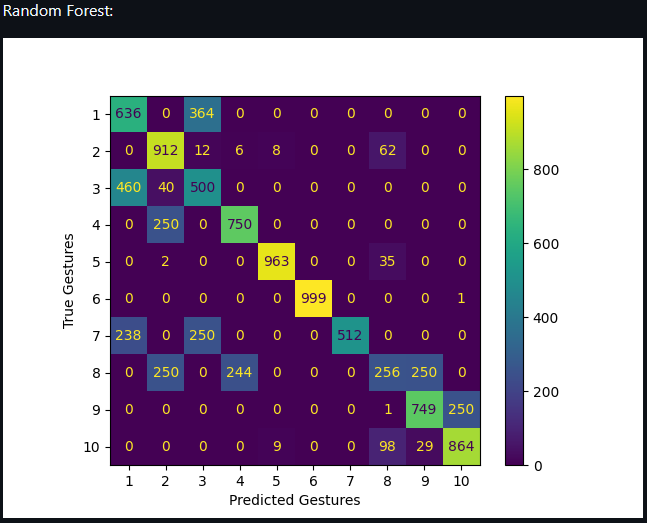
The chosen algorithms were kNN, SVM, and Random Forest, as these are among the most commonly used in related research, allowing for direct comparison with results in the literature. Using Python’s scikit-learn library, I trained models with the hand dataset and evaluated their performance, testing multiple parameter configurations for each algorithm.
The results were consistent with expectations. Random Forest showed poor performance, with little variation across parameter changes. kNN performed slightly worse than SVM, which aligned with findings from previous studies. These outcomes also allowed us to identify which gestures were harder to classify and which hand sizes were easier to recognize.
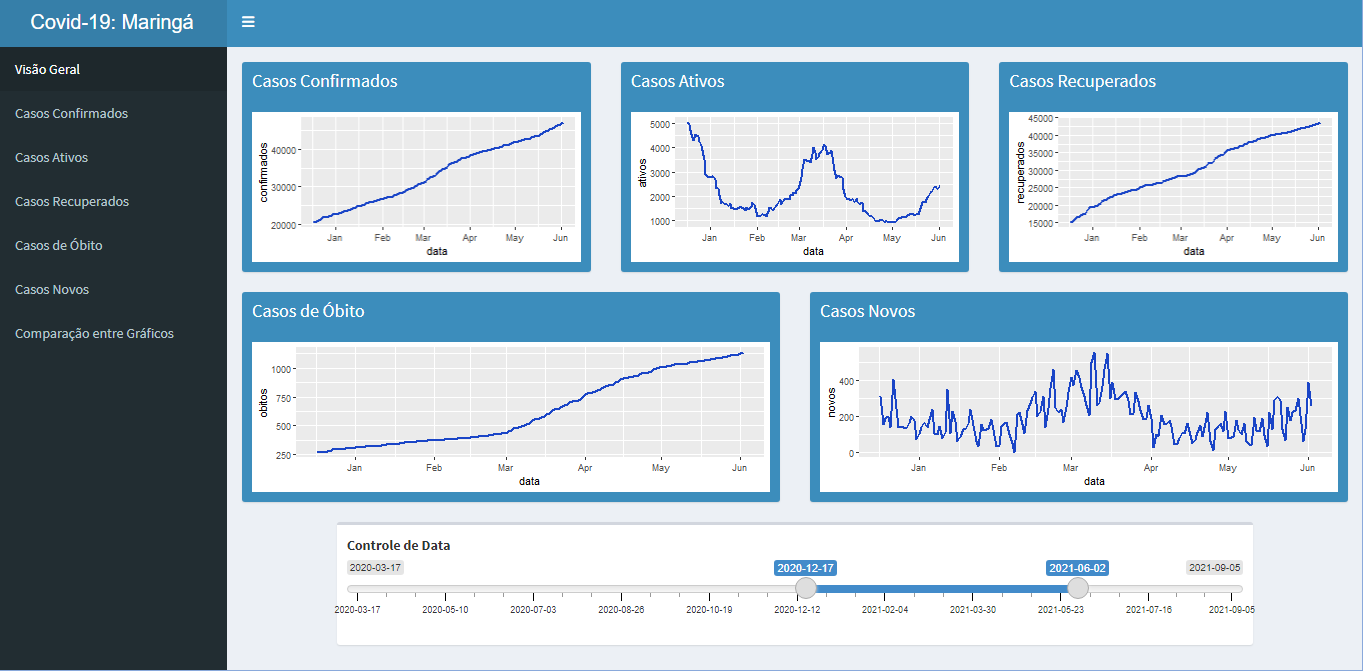
HCI-Guided Dashboard Development
This project was my Bachelor’s dissertation, where I applied Human-Computer Interaction (HCI) techniques to guide the development of dashboards. The methods applied were from dashboard design, HCI and data visualization authors such as Nielsen, Don Norman, Stephen Few, Scott Berinato, Jonathan Schwabish among others.
The work spanned five months applying a 5 step method consisting of literature study, heuristics identification, data visualization tool choice, case study to apply heuristics and pilot testing, resulteding in a prototype built with R, Shiny, and ggplot2. The dashboard was based on publicly available Covid-19 data for the city of Maringá, sourced from Kaggle.